Project Overview
This project improves bus network accessibility using GIS data, population data, and graph algorithms.
The system identifies underserved residential areas, then generates new realistic bus routes using actual roads instead of straight-line connections.
Problem Statement
Underserved Areas
Some residential zones have many people but limited access to bus stops.
Inefficient Routing
Existing routes may not connect underserved neighborhoods effectively.
Planning Challenge
Transit planners need a data-driven method for route expansion.
Technologies Used
GeoPandas
Used to process GIS datasets, create buffers, and perform spatial overlay operations.
NetworkX
Used to build the road graph and perform shortest path routing.
SciPy KDTree
Used to quickly find nearest road nodes and bus stops.
Shapely
Used for geometry operations such as points, lines, and buffers.
Matplotlib
Used to generate visualization maps for each optimization step.
How the System Works
- Load routes, stops, population polygons, and roads.
- Create a 400-meter walking buffer around stops.
- Find underserved population areas.
- Select the highest-priority underserved area.
- Snap the target area to the nearest road node.
- Find the nearest existing bus stop.
- Use Dijkstra’s shortest path algorithm.
- Create a realistic road-based route.
- Add stops along the generated route.
- Repeat the optimization process over iterations.
How Pathfinding Works
The road network is converted into a graph. Intersections become nodes while roads become weighted edges.
The system searches this graph using Dijkstra’s algorithm to find the shortest realistic road-based path between underserved areas and existing stops.
Main Code Functions
__init__()
Loads GIS datasets, converts coordinate systems, and builds the road graph.
self.routes = gpd.read_file(FILES["routes"])
self.stops = gpd.read_file(FILES["stops"])
self.pop_gdf = gpd.read_file(FILES["population"])
snap_to_road(point)
Finds the nearest road node using KDTree.
dist, idx = self.tree.query([point.x, point.y])propose_route()
Core optimization function that generates new routes.
path_coords = nx.shortest_path(
    self.road_graph,
    start_node,
    end_node,
    weight='weight'
)
Results and Iteration Comparison
These images show how the network improves over time.
Step 0 — Baseline
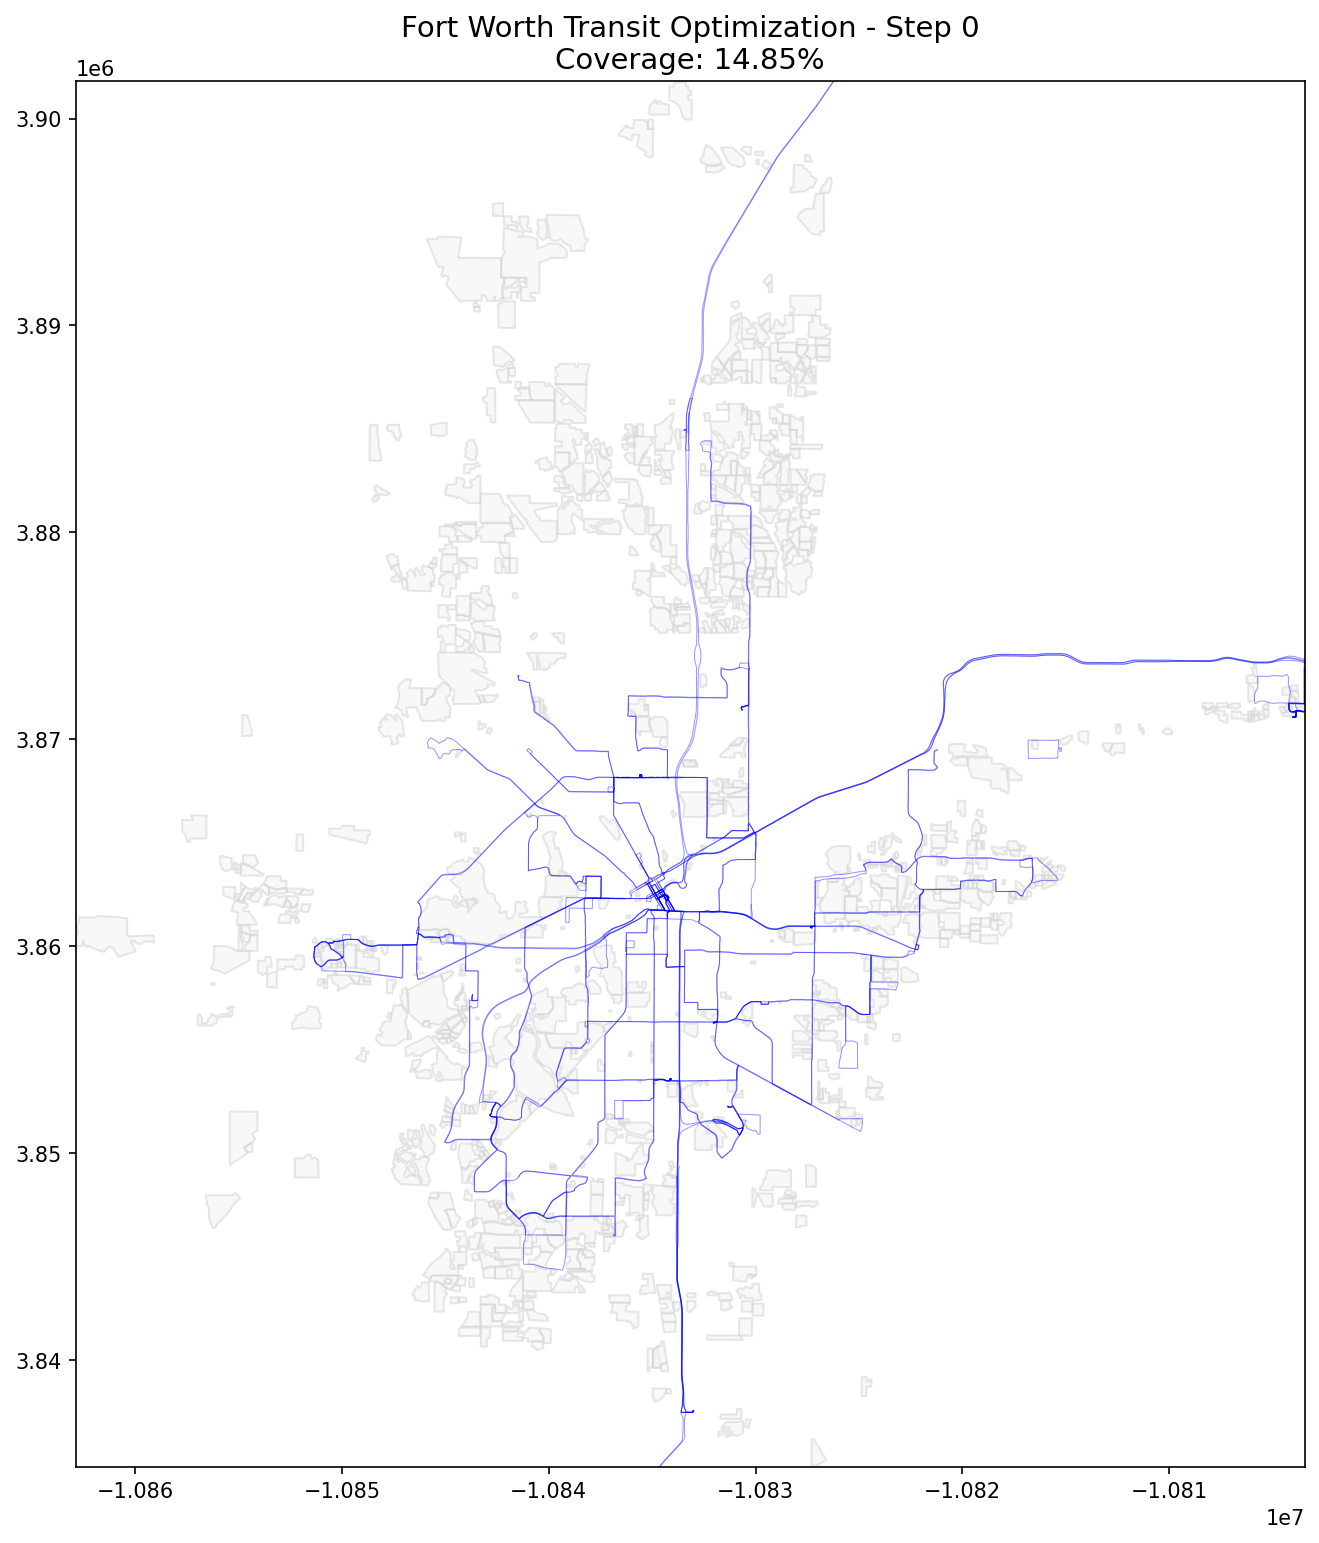
Initial network before optimization.
Step 25 — Early Improvement
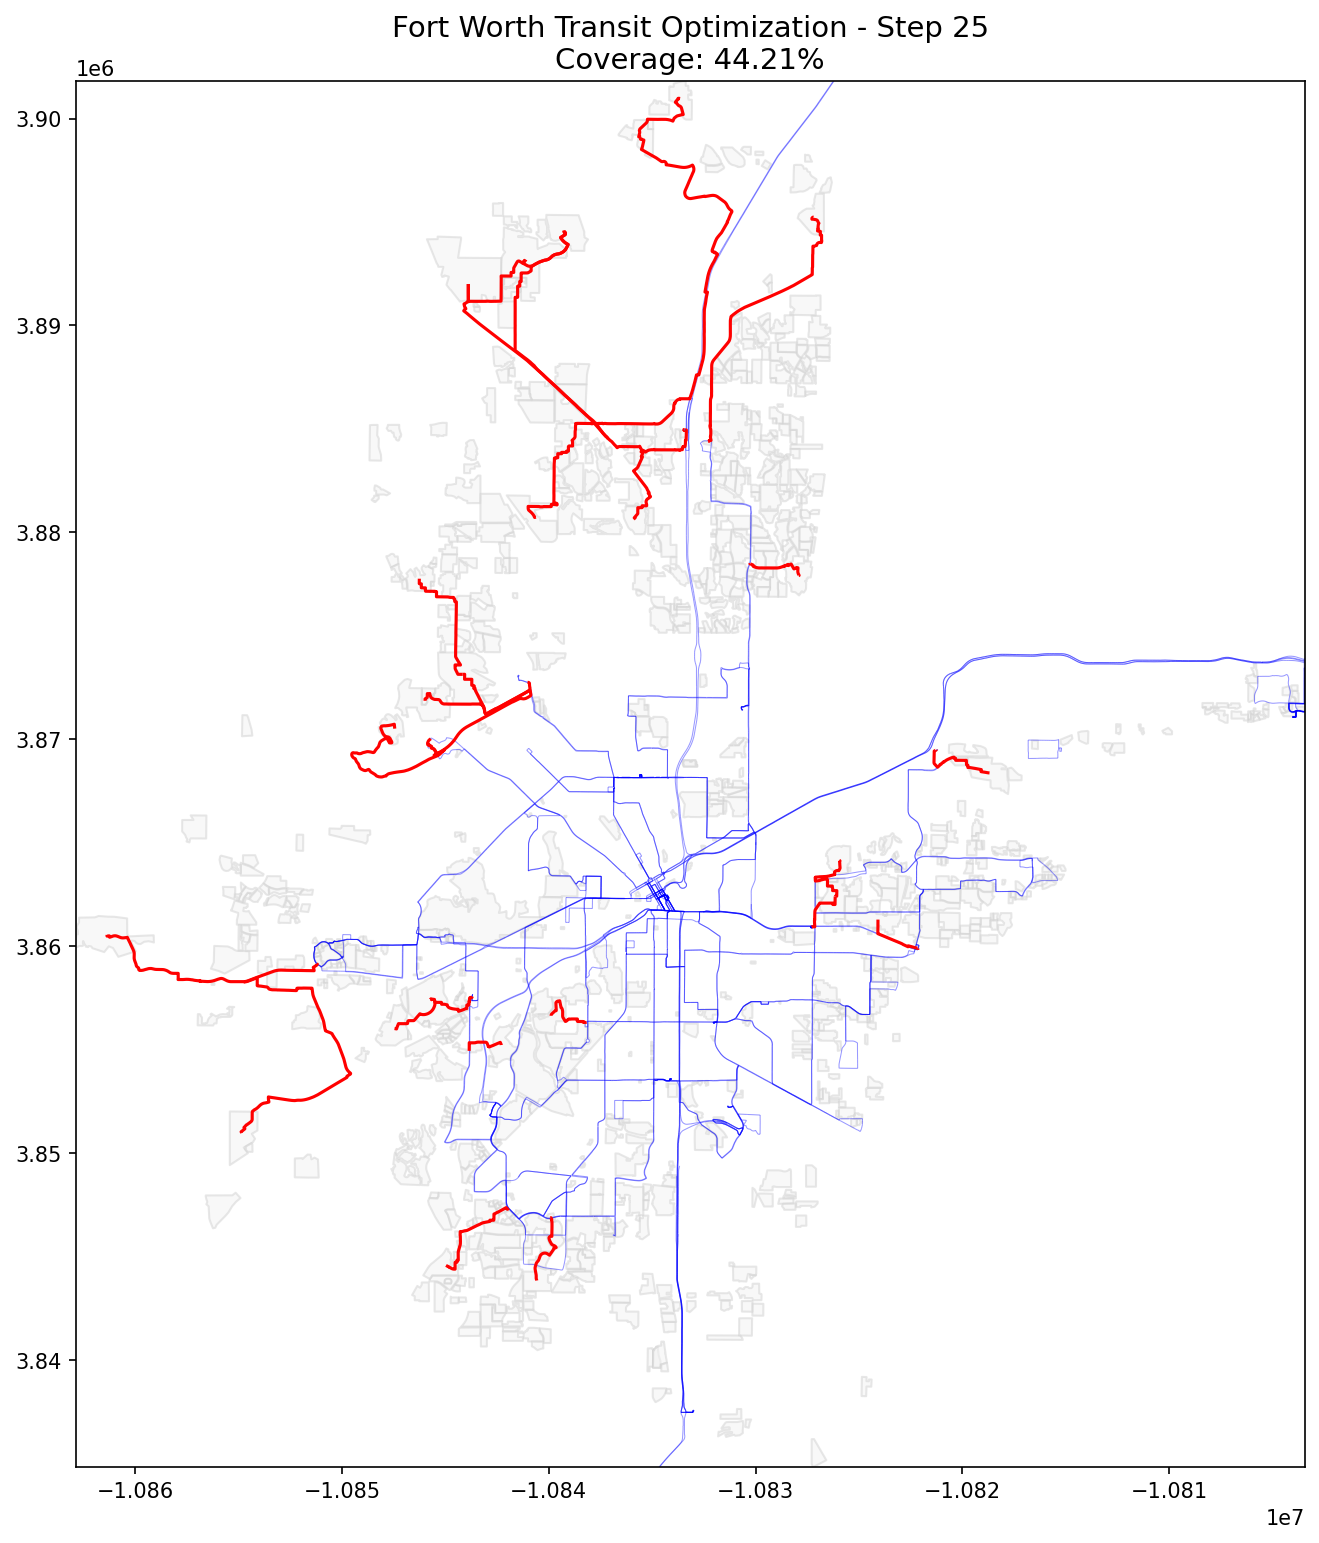
New routes begin connecting underserved areas.
Step 40 — Intermediate Network
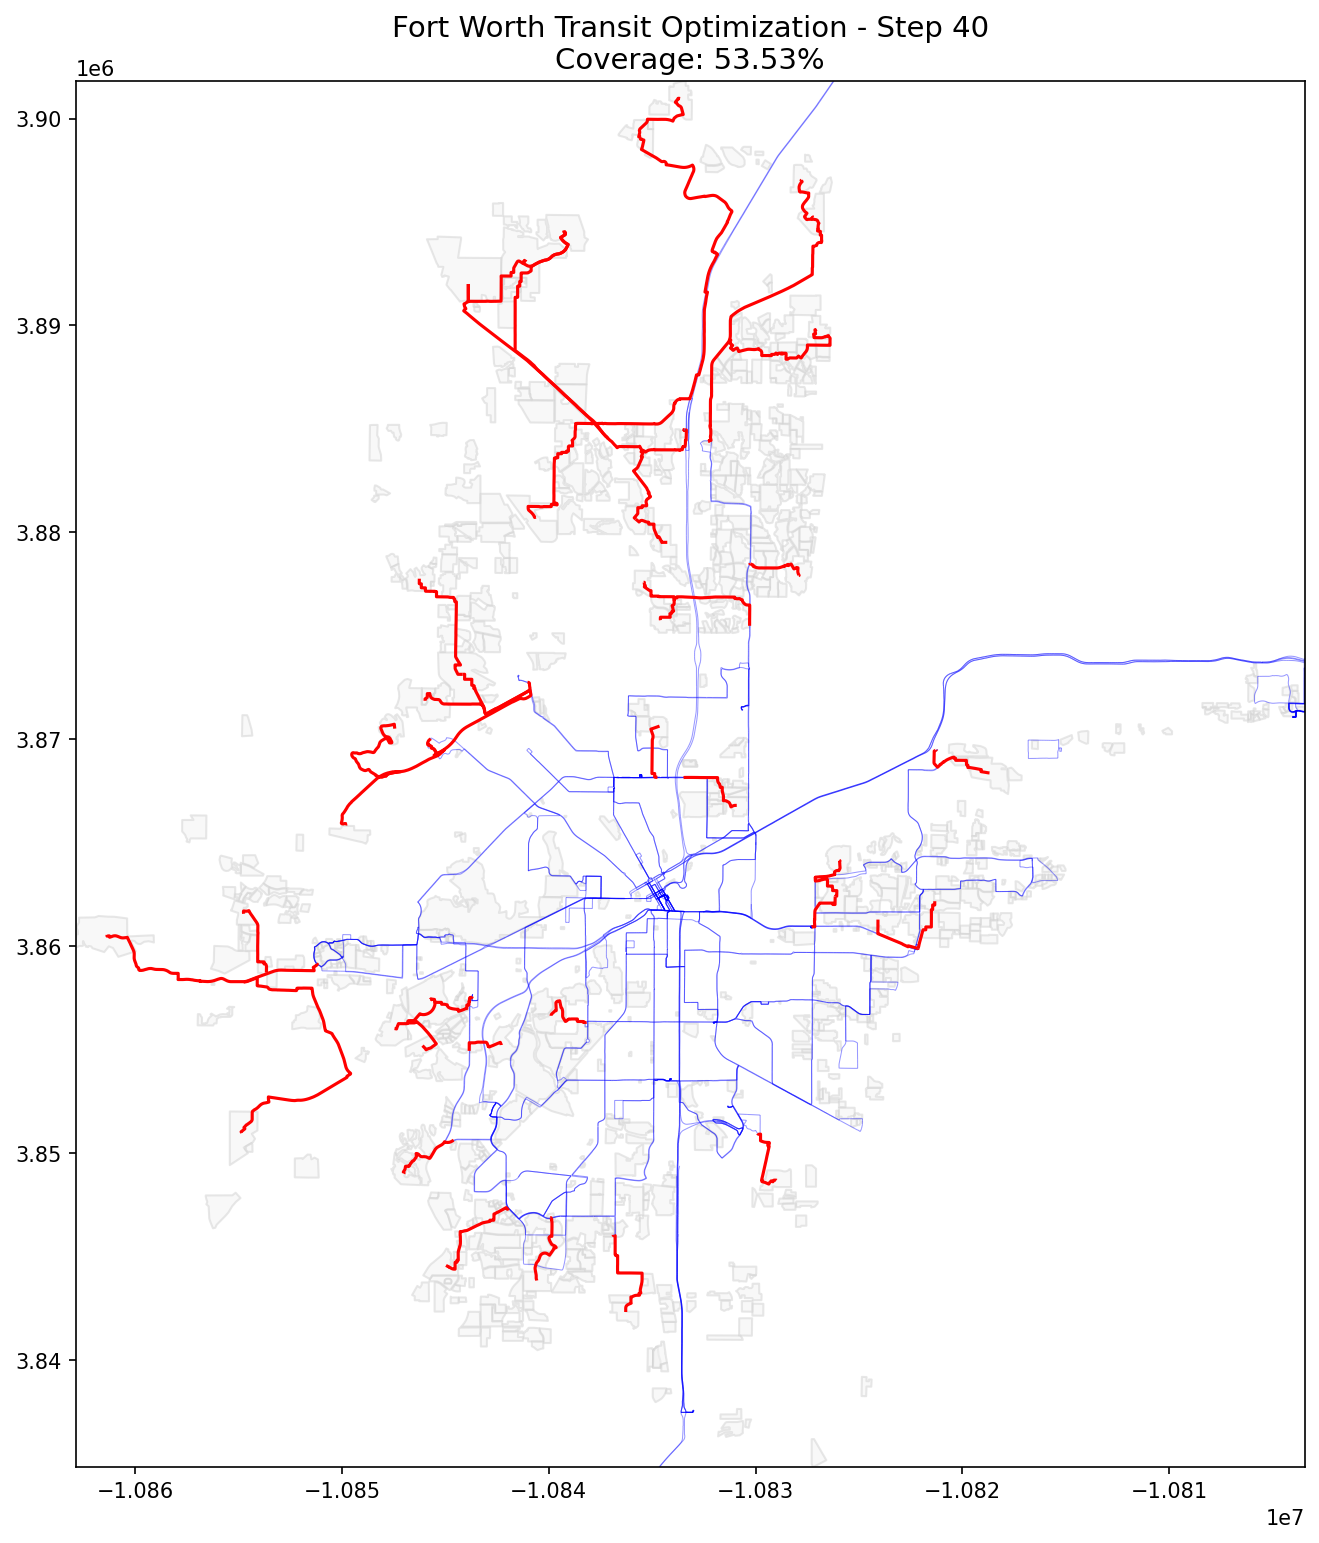
Coverage improves with additional route generation.
Step 85 — Later Optimization
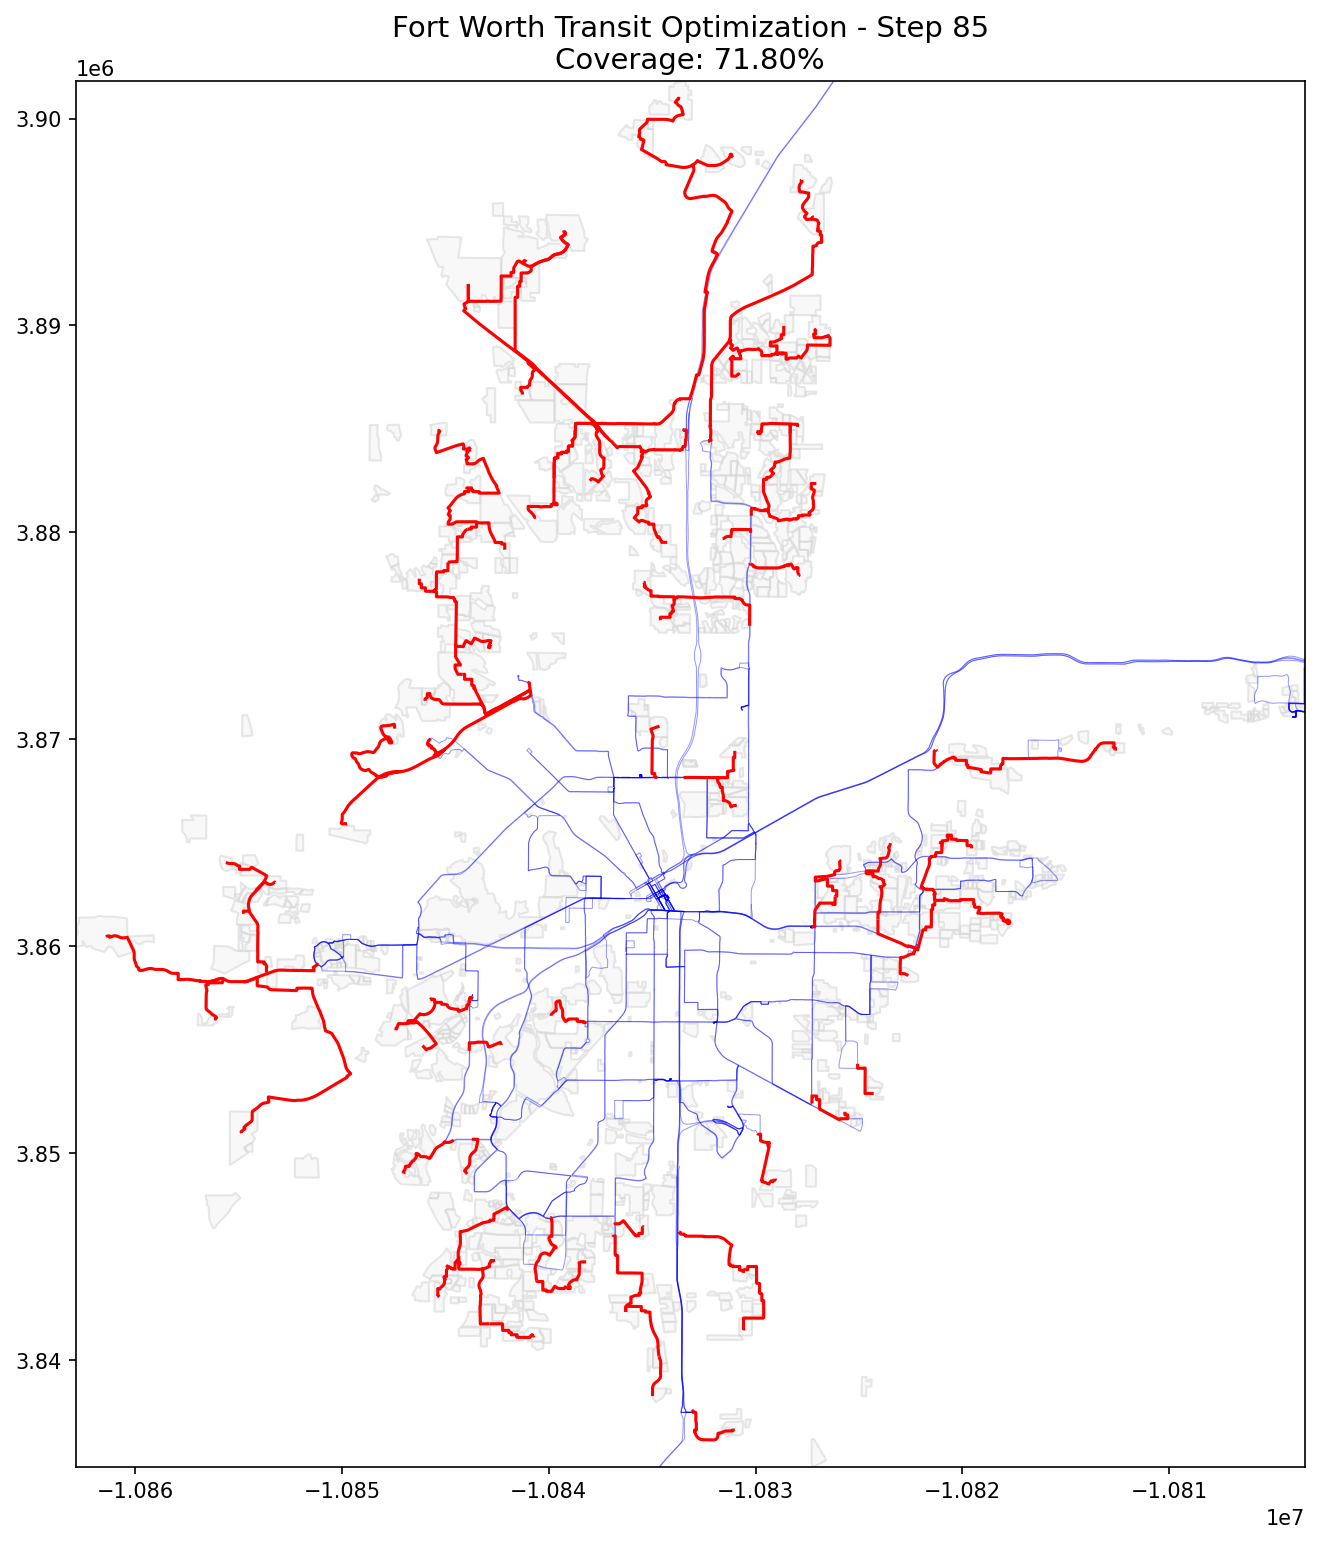
The network reaches a more optimized state.
Presentation and Project Files
The ZIP file below contains:
- Python source code
- PowerPoint presentation
- Project materials
Conclusion
This project demonstrates how GIS analysis and graph algorithms can support public transportation planning.
By using real road networks and underserved population data, the system creates realistic and data-driven route proposals.